Part 1 of our NYC Road Racing analysis focused on what was happening to races. Sadly the numbers derived from this analysis were not good, with the race calendar getting cut in half and the number of race starters declining precipitously over the past eight years. This led us to shift our focus to the individual NYC racer, to better understand how racers are entering and exiting the local scene.
To do this, we built a database of 5,880 individual riders, with a focus on four key questions:
How many rookie riders have entered the sport each year since 2012?
Of those annual cohorts, how many riders remain active in each successive year?
How long do new racers stick with the sport before quitting, and is that drop-off happening faster now than before?
How long do riders remain active in each of the three categories we specified in Part 1?
Analysis throughout by Gregory Hruby, assisted by Matthew Vandivort, edited by Liz Marcello
Creating A database of NYC Road Racers
We started with our database of riders using the sources described in the series introduction. Racers included in our cohort met two criteria: they participated in at least one Central or Prospect Park race from 2012 to 2026 and we can identify when they first started racing. 5,880 riders met our initial critereon, with a cohort that was 88% male, with the median racer completing 15 starts while one particularly dedicated rider started 617 events in our database. Our smaller novice park racer cohort featured 3,086 riders, of whom 43% competed in a single season before leaving the sport.
Table 3. Park riders and the novice cohort
Are fewer riders entering the sport than in the past?
We start our racer-level analysis by isolating the number of rookies racing for the first time at one of our two parks over the past 14 years. As shown in Figure 11, an average of 200 riders entered the sport annually between 2012 and 2019, with relative strength during the 2017-2019 timeframe when an average of 243 rookies entered the sport each year.
After COVID, rookie recruitment spiked well above pre-pandemic averages in 2021, likely reflecting a “lost” year of recruitment in 2020 combined with the well-publicized bike boom during that time period. Unfortunately, recruitment quickly returned to pre-COVID levels. This culminated in 217 rookies entering the sport in 2026, down modestly from the 2017-2019 era, but by no means a catastrophic decline in new riders.
Figure 11. Rookies entering the central and prospect park peloton from 2012-2026.
As figure 11 shows, new riders are prone to compete in a single venue in their first season. Interestingly, even with CRCA’s clinics and development fields, rookies’ preferred venue for their first season changes from year-to-year: in 2026 Prospect Park led the way, after several years where Central Park was the more important venue for recruitment.
We were most surprised by the small number of rookies that compete in both parks during their first season. But digging into numbers further, this dynamic holds true for experienced races as well: of the 5,880 racers in our analysis, 29.2% raced exclusively in Central Park, 31.3% raced exclusively in Prospect, and just 39.5% of racers participated in both parks. Said differently, the local scene is very much divided between Central and Prospect Parks.
Are riders exiting the sport more quickly?
Next, we turned to analyzing what happens after a racer's rookie year. Specifically, how long do they continue to race? How many of the 184 riders that entered the sport in 2016, which we’ll refer to as the Class of 2016, were active in 2017 and each year thereafter? This allows us to track how long each year’s group of rookies sticks with the sport.
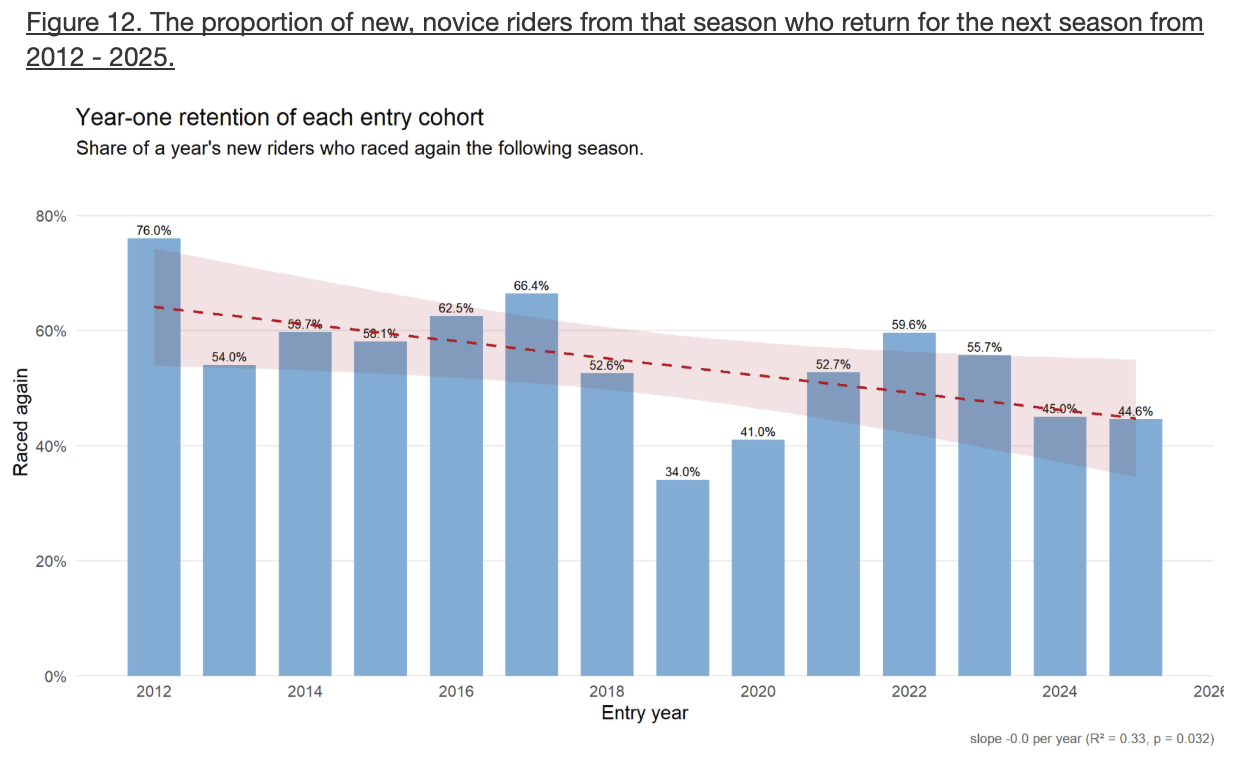
Figure 12 charts the output of this analysis with a focus on year-one retention. That is, it shows how many of those racers were active for a second season. Key takeaways from this analysis:
Pre-pandemic, approximately two thirds of new riders returned for a second season. While this may strike some as low, Tom Mains reported in our interview with him that USAC data generally shows 40-60% year one retention, so NYC historically outperforms the national retention benchmark. This strong local retention has been key to sustaining our vibrant racing community.
NYC retention levels decreased post-pandemic but remained just below 60% in 2021-2023, implying that while somewhat weaker than historical, local racing continued to outperform national data on rookie retention during the height of the bike boom.
Starting in 2024, local racer retention dropped sharply to 44%, a steep decline from the range we saw before 2019. While the data doesn’t tell us exactly why this happened, the drop-off is clear and concerning.
In short, while new rider recruitment has been relatively stable, these new riders are existing the sport fastest than at any point in history. As we show below, this is a dynamic that should be setting off alarm bells for the local racing community.
Figure 12. The proportion of new, novice riders from that season who return for the next season from 2012 - 2025.
A Shrinking Sport: Comparing the Class of 2016 to 2025
Combining the two charts above, recent decline in retention is highly concerning and foreshadows smaller field sizes in the future. Again using the Class of 2016 as an example, there were 184 new racers in our data, with 115 returning for a second season and 57 still racing in year four. This contrasts significantly with the Class of 2025, with 202 new racers, showing a subtle 10% increase in rookie recruitment compared to 2016. But it gets worse from there; weaker retention for the Class of 2025 left just 95 riders active in their second season, a dramatic 22% decline compared to the 2016 cohort in their second year.
Table 4. The 2025 cohort against the 2016 cohort
Building on this Year 2 comparison, we constructed a full matrix of multi-year retention by entry year cohort as part of Figure 14 below. This shows how racer retention tapers off over time. For instance, of the 2014 pool of new racers, 18% were still active 8 seasons later. We specifically highlight that for the 2013-2016 cohorts, 32-40% of racers remained active in their third season. This compares to only 27% of racers from the Class of 2023. Unfortunately the 2024 and 2025 cohorts will likely be worse given poor early retention trends.
Figure 14. Overall retention matrix displaying the percent of rides from their respective inaugural season participating in subsequent seasons.
How long do riders stay in each category?
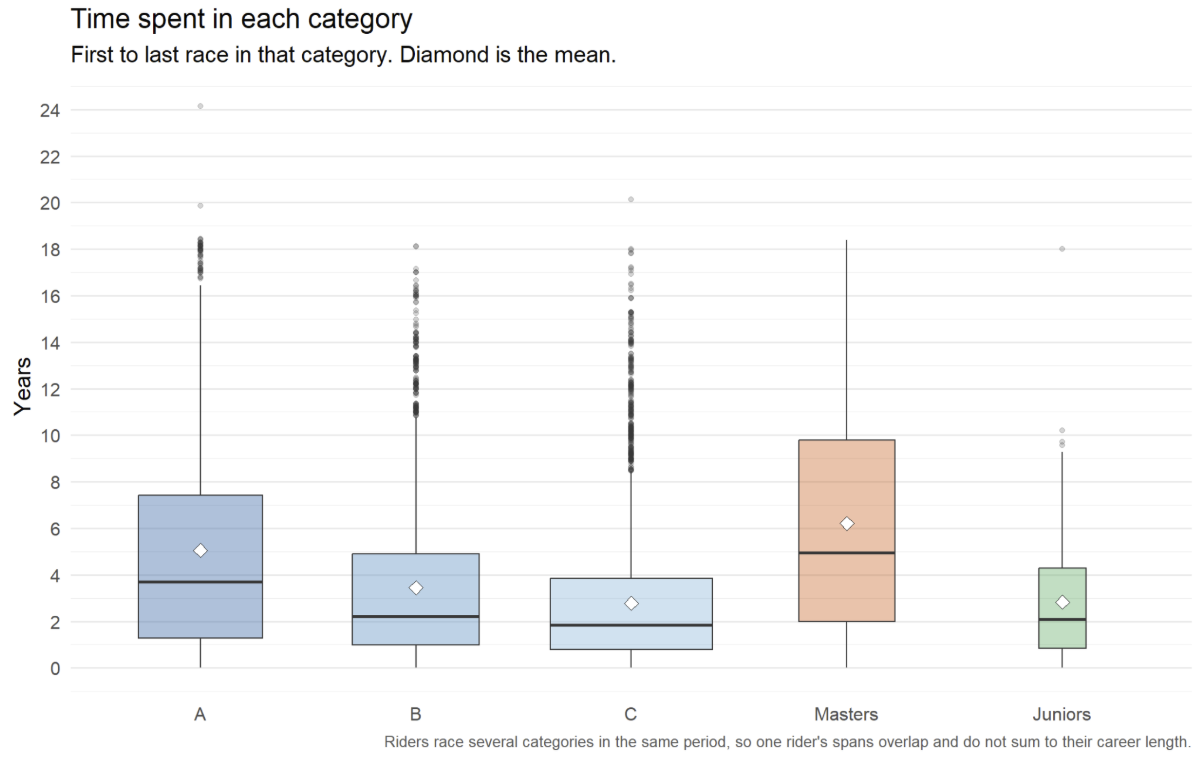
While less central to our conclusions, we also took the opportunity to analyze how much time riders spend active in each of our identified categories. Of course, some riders will race across different categories, such as a Category 1/2/3 field one weekend and a Masters field the next. As a result, these durations do not directly sum to the length of a riders racing career.
Table 5. Lays out this work with the following highlights:
Outside of Masters, A Category riders spend the longest average duration in those fields. This is largely logical: there are no higher categories to upgrade into, and the steep dropout rates we see among beginners naturally level off by the time racers reach this top tier.
Masters racers are the least likely to quit the sport. With the beginner pipeline currently drying up, this core group of veterans is, in some ways, helping to keep local race attendance afloat.
This framework is also aligned with the Category A to Category C ratio that we discussed in our event-level analysis (Part 1). That is, recent participation levels are partly supported by current Category A/Masters riders who, on average, entered the sport as part of historical new racer cohorts when year-one retention statistics were much stronger. But as the mix of the active racer population shifts to recent more poorly retained cohorts, participation levels could see further significant declines. We detail this point in our Future Outlook (Part 3).
Table 5. Time spent in each category.
Figure 15. Distribution of time spent participating in a given category for racers in our cohort.
NYC RAcer Lifecycle: Key Takeaways
Rookie recruitment peaked at 334 in the 2021 bike boom, fell through 2023, and has held steady at roughly 200 to 230 a year since, in line with pre-COVID levels.
Retention is the problem: only about 45% of the 2024 and 2025 classes came back for a second season, down from 56% before COVID and the lowest outside the COVID-disrupted years.
NYC’s racing community was historically sustained by strong retention, well above national benchmarks. That advantage held through 2023 but has now slipped sharply, so fewer rookies are making it past their first season.
Masters and Category A riders stay in the sport the longest. For now they are propping up participation even as fewer new riders stick around.
We’ll continue our analysis tomorrow with Part 3: What does the future hold
We end our examination of NYC Road Racing with a summary of our findings, our conclusions and finally some recommendations and questions for the racing community