The Abbreviated Lifecycle of a Bike Racer
In our recent State of the Sport essays and our longer time writing Analysis pieces on the Journal we have often been focused on the sustainability of ‘traditional’ categorized bike racing as we know it today. This line of analysis inevitably led us into questions on how the upswing in gravel racing is impacting road racing, a topic we started to tackle in our most recent piece: State of the Sport: What Happens When Gravel and Road Racing Collide? With some help from some friends outside the team we are in the process of analyzing ~200,000 rows of data to try to answer that question with more certainty. With that much data it will take us a while to complete the analysis so in the interim we wanted to refresh on an analysis that we first completed back in 2017 called The Demographics of Cycling.
If you read that prior piece you are well aware that new members are the lifeblood of CRCA precisely because membership retention in the Club is (spoiler alert) very weak. We are hopeful that the numbers for NYSBRA/USAC as a whole are better than those that we are about to discuss - as we touch on in the conclusion to this essay there are some reasons to think that is true (unfortunately the only data we have pertains to CRCA). But at the same time CRCA is also a unique and impressive entity: a volunteer led non-profit that doesn’t have to maximize financial return and as a result can offer a members-only 12 race series for just $100 (roughly $8 per race). Ultimately we can’t be sure how closely the CRCA numbers mirror the broader sport locally/regionally/nationally - we only have the CRCA data - but with 700 odd members in the club its a large sample size to work with.
Note: some of these charts look slightly different from the original analysis as for this essay unless otherwise specified we are focused on total CRCA membership (including associate members that cannot participate in the Club Race Series) in this version of the analysis. Also note that the data set is not thorough enough to identify riders that left the club for a period of time and then rejoined. This is likely a small number of riders that should not impact the overall analysis. Lastly, this data only pertains to CRCA so we don’t have any direct visibility on broader NYC/NYSBRA/USAC trends.
The Abbreviated Lifecycle of a Bike Racer
So with that said, we start with the count of new CRCA members by year in the chart below. We see the well recognized ‘Lance effect’ where cycling as a whole was on a growth trajectory in the 2010-2013 timeframe. During those boom years the Club saw ~250 new members joining the club each year. Then in January 2013 Lance sat down for his infamous Oprah interview and the following year new membership dropped off to its lowest levels in recent history. Since then the Club has been bouncing around +/- 200 new members per year. Unfortunately the most recent data point - 2018 - was also the worst since that big down year in 2014.

Note: includes all membership types.
With that backdrop established, we are going to take one brief detour: the percent of new members who identify as women. For those not familiar, promoting women’s racing has been core to the CRCA mission for over a decade. The Club is one of the only organizations in the area to host women’s fields throughout the duration of the year. In addition at our open races we strive to feature three women’s fields and always offer equal prize money (its 2019, if you don’t understand why we offer equal prize money you have some catching up to do). The Club has also invested heavily in its Women’s Development Series that includes women only coaching sessions, social events, and great series/participation prizes. Unfortunately the cumulative effect of all of that is… …essentially no change in the percent of new CRCA members are women. In fact last year’s count of new female members was the lowest since 2009. It is a source of great frustration and sadness that we’re not moving the needle on this front in a real way. At the moment it appears that something is structurally broken in cycling’s ability to attract new female races (the culture perhaps?). If we want the sport to survive and prosper that needs to be fixed. But that is a topic for a different essay.

Note: includes all membership types.
Shifting back to the Abbreviated Lifecycle of a Bike Racer, these numbers below represent the core of this analysis. Delving deep into the CRCA database we broke down new members by year and then calculated the number that returned in each following season to calculate member retention. This allowed us to do a complete lifecycle analysis of every racer that has joined CRCA since 2008. Starting with the ‘Season 2’ row, the number listed in each column is the percentage from that initial ‘Class’ of new members that returned for the specified season. For instance, from the ‘Class of 2008’ 59.3% of new members rejoined the club in the following season and 44.0% returned for a third season. If you roll these numbers through to the most recently completed season (2018) you will see that out of the 182 new members that joined the club in 2008 just 14 were still part of the Club. It is not included in the table below, but going back to 2007, the year that I joined the club, out of my original class of 208 new members I am one of just 10 still in the Club, making for a 4.8% retention rate.
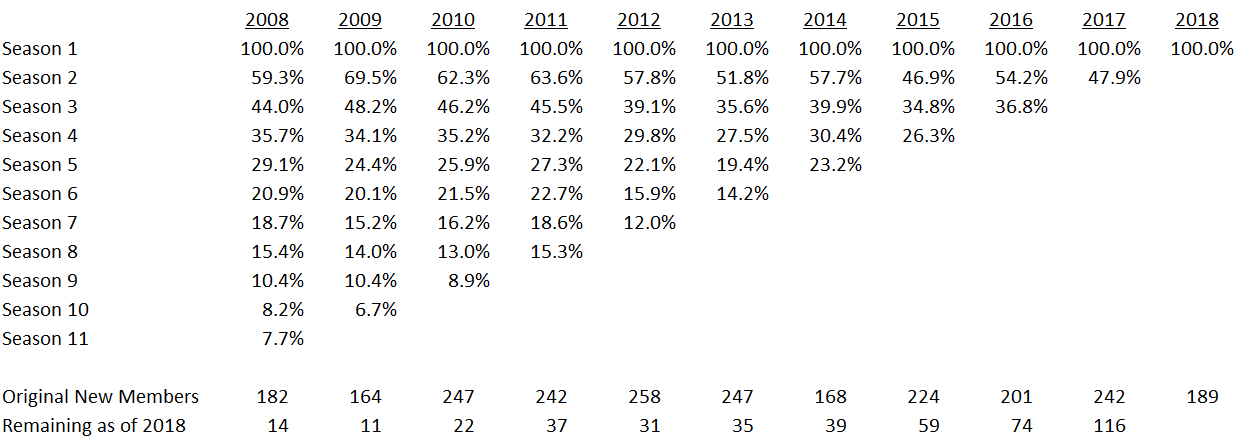
Note: this does not account for riders that left the club for a period of time and then rejoined. It is purely based on the initial year of joining the club and the last year that membership was active.
Perhaps the data point that shocked us most when first completing this analysis in 2017 was just how low the Season 2 retention is for CRCA. And as the numbers above showed, this is a metric that has gotten worse, not better, in more recent times. In fact on average for the past three years just ~50% of new members have returned for a second season in the club. It is hard to overstate just how big the number of non-renewals are: fully half of the riders that take a chance and join the Club get to the end of their first season and say ‘no thanks.’ And this is for an organization with a heavy emphasis on development with New Rider Clinics and a completely free season long coaching program.

As you might expect, the drop off in membership retention observed in Season 2 continues for Season 3. For the four most recent cohorts that we have data for the retention rate for a third season is a paltry 37%, meaning just a third of members make it to a third season of racing in the Club:

By now you probably know what is coming next. Another chart highlighting that membership retention trends for Season 4 have trended in the wrong direction over time, with just 25% of the club’s 2015 class of New Members remaining active through a fourth season. This is a pretty substantial decline from the ~35% Season 4 retention observed for the Classes of 2008, 2009, and 2010.

Combining all of this data for the nine years of new members that we have multiple years of data for and we see that the overall retention curve has held over nearly a decade of new sign-ups +/-10%. However, within that range, as the charts above highlighted, new member retention has generally gotten worse over time. In fact, when we put together our original analysis, the ‘Class of 2017’ was still in the process of joining the club for the first time. But ~18 months later they have already showed some of the worst Season 2 retention on record with less than 48% of members returning for a second season (only 2015 has been worse):

Charted differently as membership churn, it is obvious that membership losses are most severe in season two with only approximately half of new members returning for another year of racing. That said even in the seasons that follow the club steadily losses 20-30% of the remaining pool of each class of new members with each passing season.

After more than a decade as part of CRCA I am still surprised by how many new faces I see year to year. These weak retention statistics certainly play a big role in that perception. As the pie chart below right highlights, of Active Members at year-end 2018, only half were in the club before 2016. The simple fact is that the Club’s membership turns over so rapidly that most new faces won’t be around long enough to become familiar faces. Which is perhaps what makes community building within the cycling scene, and the sustainability of the leadership structure for the Club, so difficult.


If we net these numbers all together and return to the topic of the size of the Club, where does it leave us? Unfortunately its not the prettiest picture. Even with some significant changes that should arguably increase the ‘value’ of CRCA Membership, like professional results and upgrade points for the Members only Club Series and early registration pricing held at $100 for many years despite significant cost inflation, the net change in membership (new members less non-renewing) has been significantly negative in two of the past three years and cumulatively negative over a five year timeframe:
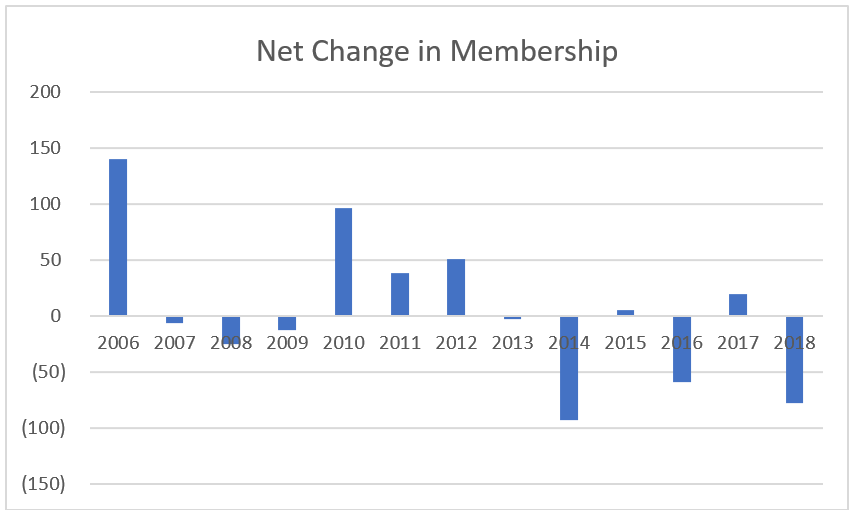
Note: all membership types
Thankfully some of these numbers are thrown slightly off by associate memberships (a form of non-racing memberships offered by CRCA). When focused exclusively on CRCA Racing Memberships there is a greater degree of stability in the numbers. Yes, in the Lance years racing members broke through the 750 barrier for the first time, albeit briefly. But after an initial decline in 2013 the Club’s roll of racing members has hovered in the same 650-675 context for a number of years. The churn of membership out of the club is absolutely massive, but thus far the club has mostly been able to offset these losses with new members.

Note: Racing Members only, excludes Associate members.
Of course, 2018’s Racing Membership count (637) was also the lowest on record since all the way back to 2009. And therein lies the risk: since 2009 the Club’s event calendar has grown with the addition of the Grant’s Tomb Criterium and the Orchard Beach Criterium at the same time that the complexity and cost of nearly every single aspect of the club has increased. From higher USAC insurance fees to the number of marshals and team duties required for races, the race calendar hasn’t gotten any easier. Which means that it wouldn’t take much more of a decline from 2018 levels for the club to start feeling the squeeze - on race marshals in particular.

And sure, some of the challenges facing CRCA are different from the country as a whole. In particular the cost of living in New York City tends to price residents, including residents who race bikes, out of the city at some point. And when New Yorkers relocate to wherever they decide the grass is greener, they inevitably churn out of the Club’s membership rolls. But still, I would describe the numbers discussed herein as pretty lackluster at best. Losing half of your ‘customers’ in the first year is not a great business model, and it doesn’t seem to bode well for the long-term sustainability of racing. We recognize that CRCA has been around since 1898, surviving any number of tough times. But the trends underlying these numbers, from limited progress on breaking the 85/15 gender barrier to worsening retention rates do not speak to a healthy growth (or event stability?) dynamic for the sport or the Club.
All of which returns to the core question we have been asking in our various Analysis essays - what can we do to improve the general health of the sport? How do we make events more sustainable, or in the instance of this specific analysis, how do we improve new member recruiting and retention? We are not proposing answers herein, but given our deep admiration for what CRCA is and the role it serves, we’d love to find ways to improve the outlook. The comments are open…