There is a generally accepted belief that the local road racing scene in New York City is shrinking. The TBD Journal has provided years of analysis on the state of road racing, but the magnitude of recent declines for certain events warrants a closer examination of the overall numbers underlying NYC road racing.
To that end, over the next several days we are publishing a series of articles that we believe provides the deepest dive ever conducted on the state of the sport in NYC. As forewarning, this series is lengthy, with over 10,000 words and dozens of exhibits derived from a massive dataset that we constructed over several months. Broadly speaking, it is organized in four key parts:
What is happening to races - both the number of events on the calendar and total participation?
What is happening with racers - are fewer racers joining the sport? Are they quitting sooner?
What does the future hold given the data we collected on races and racers?
Is women’s racing following the overall sport, or are there signs for optimism here?
Our ultimate aim is to publicize facts the local community can rally around to find solutions that stabilize and hopefully grow the sport. We use “community” intentionally because we believe sustaining the racing scene is a shared responsibility. The collection of teams, clubs, and race directors that make up New York City road racing may feel particularly fractured as of late, but if recent declines continue then we’re all on the same sinking ship. This leaves a shared responsibility to implement the changes necessary to keep road racing alive in New York City.
Analysis throughout by Gregory Hruby, assisted by Matthew Vandivort, edited by Liz Marcello
A preview of what we found
(1) What is happening to races:
We started by examining NYC racing at the event level, observing significant declines in the number of races and the field sizes of those events. In 2018 there were 70 races in NYC. By 2026, this had been cut in half to just 35 events. During this same time period, average field size also declined from 37 to 32 racers. With the number of races and field size declining by 50 and 15%, respectively, the total number of starters at NYC events shrank from a peak of 11,164 in 2019 to just 5,365 this year, a reduction of 52%. By every measure total road racing participation has declined dramatically compared to the pre-COVID era.
We expanded our race analysis to review these declines by venue and field categories. Central Park race participation is down 54% since 2019, while Prospect Park is down 32%. However, the single biggest loss was weekday racing, which represented a quarter of all local race starts at its peak, before ending completely after the 2023 season.
Diving one level deeper into category level race trends, our most concerning observation showed a significant decline in novice/Category C field starts, both on an absolute basis and relative to higher category fields. This finding led us to dive into data on individual racers and how they’re entering and exiting the sport.
(2) What is happening to racers:
In our second analysis, we examined data at the individual racer level, looking at any racer that participated in a Central Park or Prospect Park race between 2012 and 2026. Interestingly, compared to the Pre-COVID era, the post-COVID era actually attracts more rookie racers:
Between 2012 and 2019 an average of 200 rookie racers entered the road racing community each year, though in the final three years before COVID this increased to an average of 240 rookies per year.
Rookie trends have been volatile post-COVID. After an initial spike to 334 new racers in 2021, 217 rookies entered the scene in 2026.
So over the past four years, the sport has seen an average of 206 rookies annually – slightly above the 2012-2019 average (200) but short of the 2017-2019 peak (240). We then focused on how long these rookies stay in the sport, observing that new rider retention is at historical lows: Retention levels pre- and post-COVID varied around 56%, but this has declined by 11 points for the past two years with just 45% of rookies from 2024 and 2025 continuing for a second season. This is the most concerning data point from our analysis, which we’ll discuss in detail in Part 3.
Interestingly, this analysis provided a surprising venue-level insight: of the 5,880 racers in our analysis, 29.2% raced exclusively in Central Park, 31.3% raced exclusively in Prospect, and just 39.5% of racers participated in both parks. This overlap between the two parks was much lower than we expected, highlighting the degree of fragmentation in our local community.
Finally, we assessed how long racers spend in each race category. Perhaps unsurprisingly, we found racers spend the least amount of time in category C and spend progressively more time in each category as they advance to B and ultimately A. This suggests that without improvements to rookie recruitment and retention, higher racing categories will gradually get smaller and smaller. This prompted our third area of investigation: how much recruitment and retention is needed to stabilize/grow the size of our community.
(3) What does the future hold:
Building on our racer-level data sets, we modeled hypothetical future cohort sizes based on historical retention trends. In short, if only 45% of the new 2026 rookie class sticks around for a second year, and then continues to drop out at the normal pre-COVID rates, this class will be 16% smaller by year three than we’ve historically seen. Bottom line: without clear action overall participation will continue to shrink.
With this in mind, we examined the retention and recruitment levels required to sustain the sport at overall 2026 participation levels. This model highlights the potential for our community to continue shrinking if we sustain our current trajectory, even after the significant declines experienced since 2019. If recruitment and retention stay where they are, the racing scene shrinks a further 6% by 2031, to about 1,090 racers.
We also examined variables associated with better retention: the strongest predictor of racing a second season is the number of races completed in their first season.
(4) Is women’s racing following overall declines:
We also used our combined data sets to examine women’s racing. The women’s race calendar has held up better than the overall race calendar, boosted in part by Prospect Park re-introducing a women’s field. Likewise, women’s recruitment and retention has also been more stable than for the overall community, though 2026 metrics deviated from that trend.
A Preview of Our conclusions
The data presented confirms what we have all seen firsthand: fewer races, smaller fields, and a shrinking racer base. In many cases, these declines were worse than we imagined when beginning this project, especially when it comes to rookie retention. The bottom line is clear: if we don’t act to reverse these trends, our community will keep shrinking, putting the survival of road racing in New York City under threat.
Given current circumstances, we believe the only option is for the entire community – clubs, teams, and individuals – to come together around the key areas identified to support bike racing in NYC. In our full Conclusion and Recommendation section, we propose several potential community actions, but welcome ideas and feedback from the wider community.
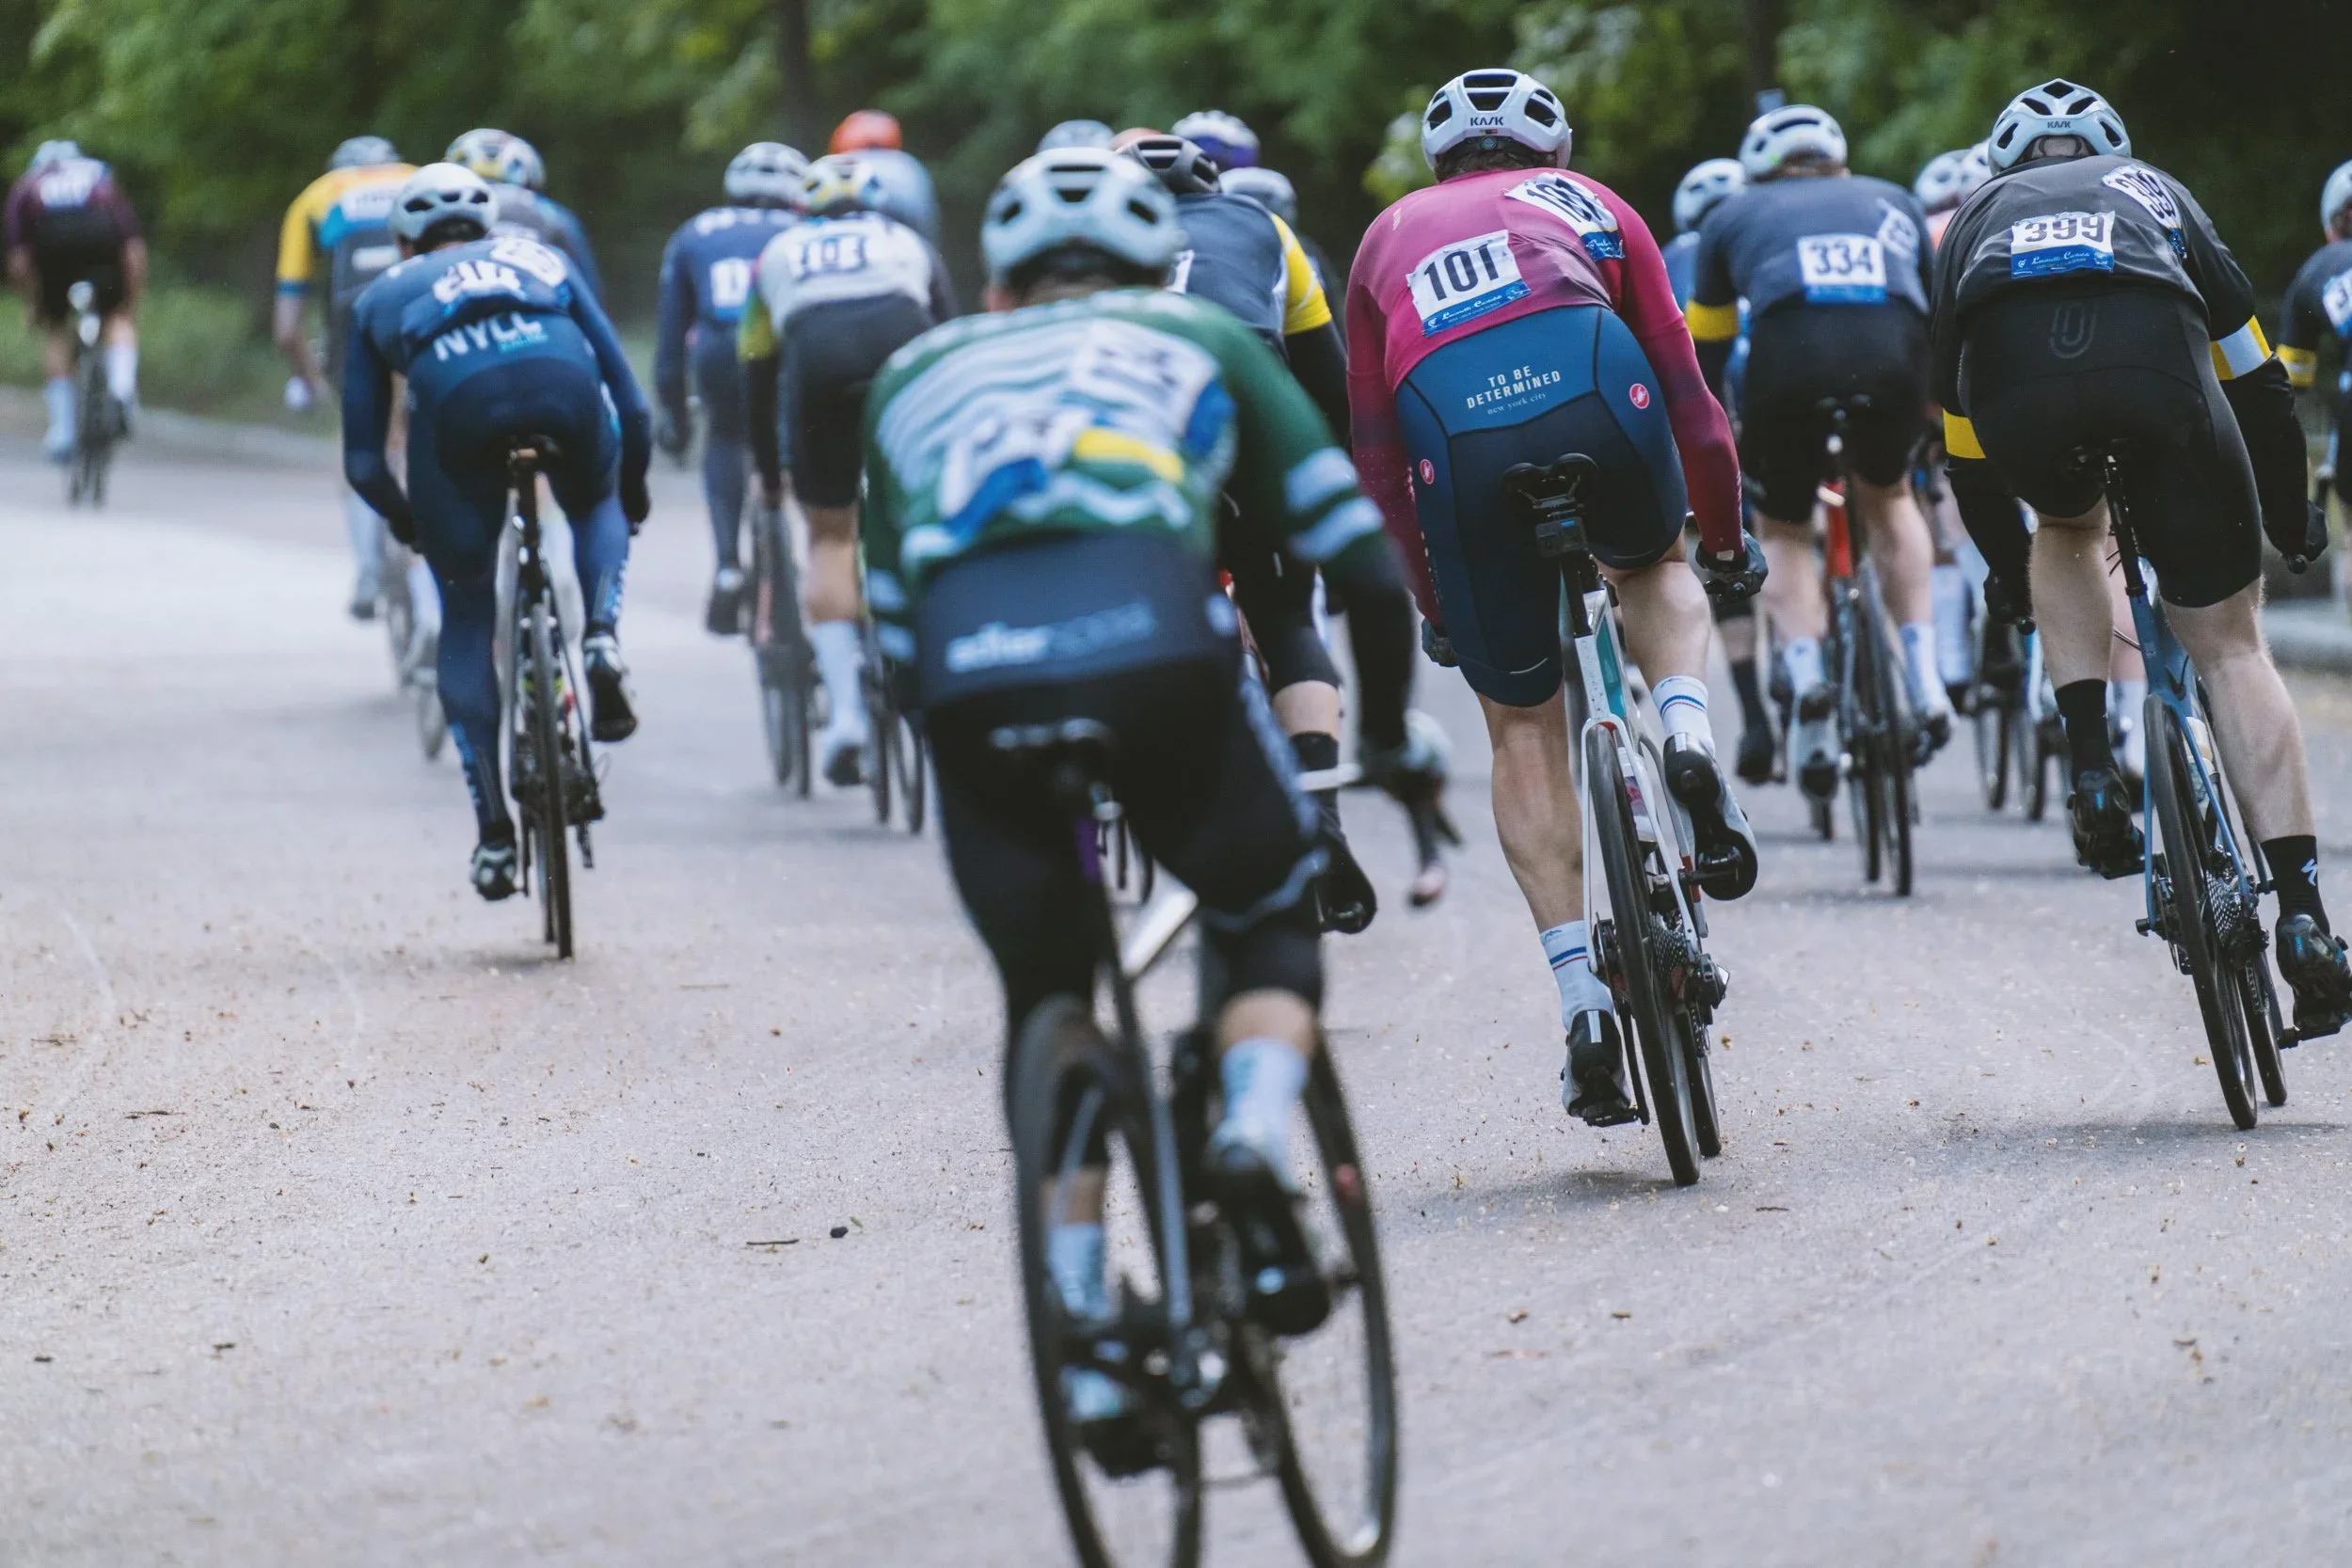
Early morning racing in Central Park, a core component of our analysis.
A Note on Data and Methods
We compiled data from multiple sources. Our primary source was road-results.com. We supplemented this data with usacycling.org and CRCA’s internal race rosters. With this data, we created an event-field cohort to specifically examine racing within the New York City area, including those within the five boroughs. In addition, we arbitrarily selected bellwether New York Upstate events to serve as a counter factual to our NYC observations. We specifically targeted categorized, USAC- and NABRA-sanctioned road or criterium races, and excluded gran fondos and time trials. Race locations are specified below, and grouped by two regions: NYC and Upstate. We placed no time restrictions on our query.
NYC: Central Park, Prospect Park, Branchbrook, Bear Mountain, Grant’s Tomb, Randall’s Island, Orchard Beach, Rockleigh, Floyd Bennett Field (FBF), Harlem, White Plains, Coney Island, World’s Fair, East NY, Rockland Lake and Staten Island.
Upstate: Battenkill, Catskills, Cap Region, Trooper and Hunter Mountain.
For the racer analysis, we exclusively queried road-results for every racer appearing in either Central Park or Prospect Park races from 2012 to 2026. For each racer, we compiled their complete result history from their profile page, including races in locations not included in our event-level analysis. We selected a distinct list of racer participants and, to account for duplicate accounts, we merged accounts where the name matched (including first/last reversals) and the birth years agreed or one was missing. Pairs sharing a name but carrying different birth years were left separate.
From here, we standardized the field names for both cohorts. Promoters name their fields inconsistently, with over a thousand distinct names for a handful of underlying contests. We therefore mapped every field to one of five standard categories. Broadly, we refer to Category A as Elite, Category B as Intermediate, and Category C as Novice. Correlation to USAC categories is as follows:
A — Pro, Cat 1, Cat 2, and combined 2/3 fields
B — Cat 3 and combined 3/4 fields
C — Cat 4, combined 4/5, and Cat 5 fields
Juniors — fields restricted to U23 or a younger age band
Masters — fields restricted to racers 35 and over
Age restriction takes precedence over category, so a field advertised as “Cat 5 45+” we counted as Masters rather than C. We also retained the original field name so anyone can read our datasets (found in the appendix), and recreate our analysis.

Our deep dive into NYC road racing begins with a look at the race calendar and the significant losses in the number of races and race starters over the past seven years