Moving past the future outlook from Part 3, we now focus our analysis on the women’s fields. This work highlighted that women’s racing has not followed the same overall decline as men’s. The sample size is smaller for the women’s side, but because these fields trend differently, we wanted to examine them in more detail.
For this analysis, two important considerations to keep in mind:
Women’s fields are usually broader in category range than men’s, so a combined women’s 3/4 field lands in C under our grouping. That is why our women’s B line is thin throughout: it reflects how promoters organize women’s fields, not women declining to race Cat 3.
Because the women’s fields are smaller, the year-to-year data is naturally much more volatile. Given this, we recommend focusing on multi-year trends as opposed to any single season of racing when thinking about growing and retaining racers in women’s categories.
Analysis throughout by Gregory Hruby, assisted by Matthew Vandivort, edited by Liz Marcello
Women’s Races and Fields: A source of Growth?
We start with the same event-level analysis featured in Part 1, this time isolating women’s fields. As with the broader data set, records before 2014 are a bit spotty due how CRCA results were reported to USAC during that time period.
The number of events hosting women’s fields has generally increased compared to pre-COVID, which is notable against the backdrop of an overall race calendar that has declined sharply. The number of women’s fields has been more variable, including significant declines in each of the last two seasons, but the takeaway remains: the women’s race calendar has held up better than the overall calendar. Just as we see across the entire race calendar, attendance rises and falls with the number of available races. Because of this, women’s participation also has outpaced the broader scene. Unfortunately, average field sizes, which are a key ingredient for exciting, competitive racing, have remained stagnant.
Table 11. Women's racing by year
Figure 16 breaks down starter counts in graph form. While there has been year-to-year volatility in women’s field participation, the overall trend is clearly better than observed for the broader community. In fact, even after a disappointing 22% drop in 2026, this year’s women’s field starts were slightly above 2019 levels.
Figure 16. Women’s total starts from 2008-2026.
For comparison purposes, here is the equivalent chart for the overall local racing community over the same time period.
Figure 17. Total starts from 2008-2026 (all genders)
HOw is Women’s Participation Trending across Categories?
As noted, category-level analysis is more challenging for women’s racing given the prevalence of “all category” field structures. That said, whereas pre-COVID data suggested a relatively poor Category A to Category C ratio for women, recent trends have been more favorable.
Figure 18: women’s starts by category 2008-2026
As noted, women’s field sizes have been relatively stable in recent years. While we’d all love to see bigger fields to improve the in-race experience, women’s racing is definitely more stable than it is in the broader NYC community.
Figure 19. Women’s field size distribution from 2008-2026
Anchored to Central Park, but recent Growth in Brooklyn
Turning to venue dynamics for women’s racing, Figure 20 is unsurprising given the near decimation of the upstate road racing calendar as compared to a decade ago. This leaves women’s racing concentrated in the NYC area.
Figure 20. Women’s Regional participation from 2008-2026.
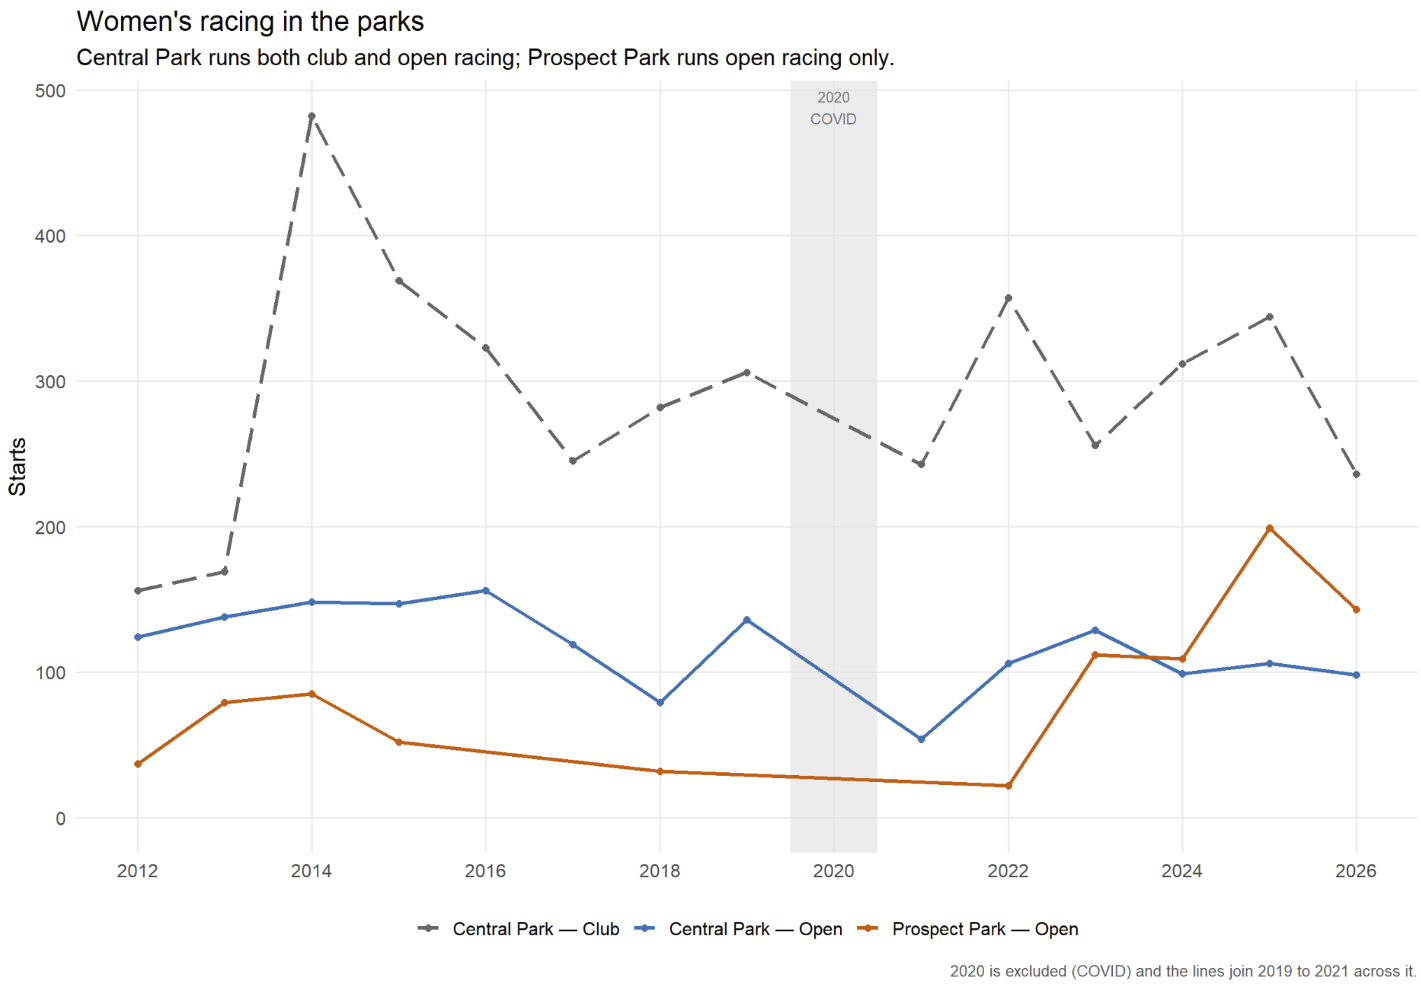
Breaking down women’s racing between NYC’s two main parks shows higher start counts in Central Park, likely reflecting the more expansive women’s racing field structure in that location. Importantly, the recent expansion of women’s racing in Prospect Park shows positive growth even as fewer events and fields leave Central Park as the more important venue for women’s racing.
NYC Women Racers: the Statistics
We repeated our Part 2 racer-level analysis for women alone, applying exactly the same cohort criteria: a first race day in a Category C or Juniors field, a first season after the first year in our data, and a Central Park or Prospect Park start in that first season. Table 12 describes the women behind the figures that follow, alongside every woman who has raced a park since 2012. The women’s cohorts are much smaller than the overall ones, so a single racer moves a percentage noticeably. We read these figures for multi-year patterns rather than any one season.
Table 12. Women park racers and the women's novice cohort
Rookie Recruitment and retention
Through 2025, new racer recruitment was remarkably stable for women’s racing, with 2021-2025 trending above pre-COVID averages. However, as was the case for overall rookie recruitment, since our boom in 2021, we see a downward trend. This is clearly a concerning indicator for future participation levels. Note that Central Park is far and away the most important venue for rookie women, likely reflecting the CRCA Women’s Development Field.
Figure 22. Women, rookie participating for the first time within the NYC race community.
Retention year to year within the women's field is highly variable, making it difficult to draw any significant trends from these figures.
Figure 23. The proportion of Women, New, Novice racer retention after their inaugural year from 2012-2025.
Comparing Womens Cohorts By Year
Returning to our cohort analysis from part 2, the Women’s version of the 2016 vs 2025 table looks very different given strong post-COVID recruitment trends that more than off-set slightly lower retention percentages.
Table 13. Women: the 2025 cohort against the 2016 cohort
Figure 25. Retention matrix for women, displaying the percent of each entry cohort still racing in subsequent seasons. Cohort sizes are shown beside each entry year.
How Long Do Women Stay in Each Category?
Table 14. Time women spend in each category
Figure 26. Distribution of time women spend participating in a given category.
Women’s Racing: Key Takeaways
Women’s racing has shown good overall stability even as broader participation across the local calendar has worsened significantly in recent years.
While our data set does not identify the qualitative aspects of this stability, we speculate there is a “if you build it, they will come” Field of Dreams dynamic with growing/stable field counts supporting relatively better participation trends.
That said, women’s racing does not escape the broader softening in rookie recruitment and retention, the combination of which threatens the relative stability in participation.
2026 participation trends were very weak compared to 2025 - our data did not identify a reason for this significant decline



We end our examination of NYC Road Racing with a summary of our findings, our conclusions and finally some recommendations and questions for the racing community